THE CARBON MARKET
Climate change has become a major global challenge, with greenhouse gas emissions from production and consumption activities continuing to rise. To reduce emissions and meet the targets set under the Paris Agreement, many countries have committed to reaching net-zero emissions. The carbon market has emerged as an economic instrument that enables parties to trade emission allowances, thereby promoting cost-effective emission reductions. This mechanism also serves as an incentive for enterprises and nations to invest in green solutions and sustainable development.
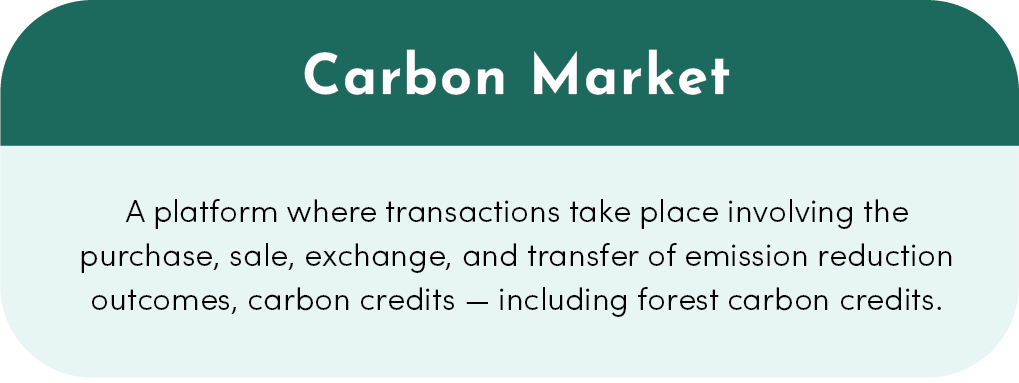

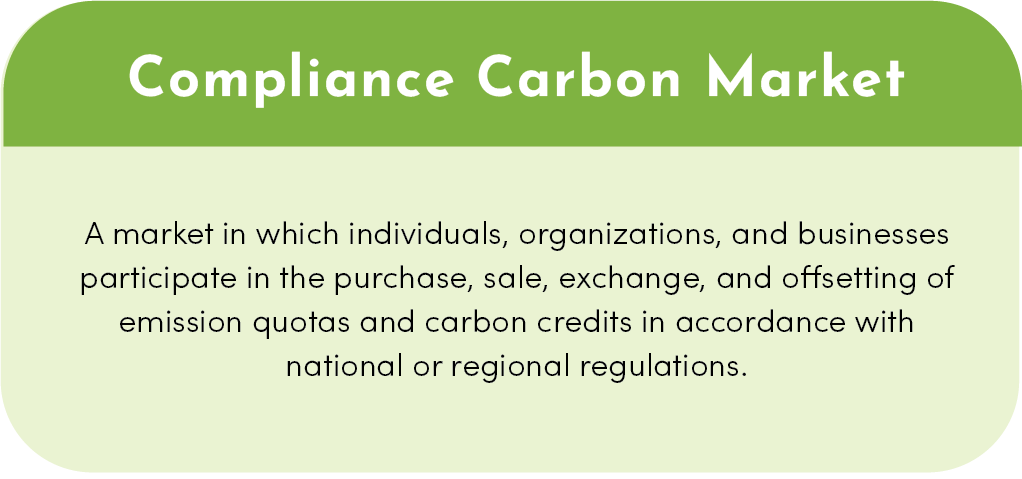
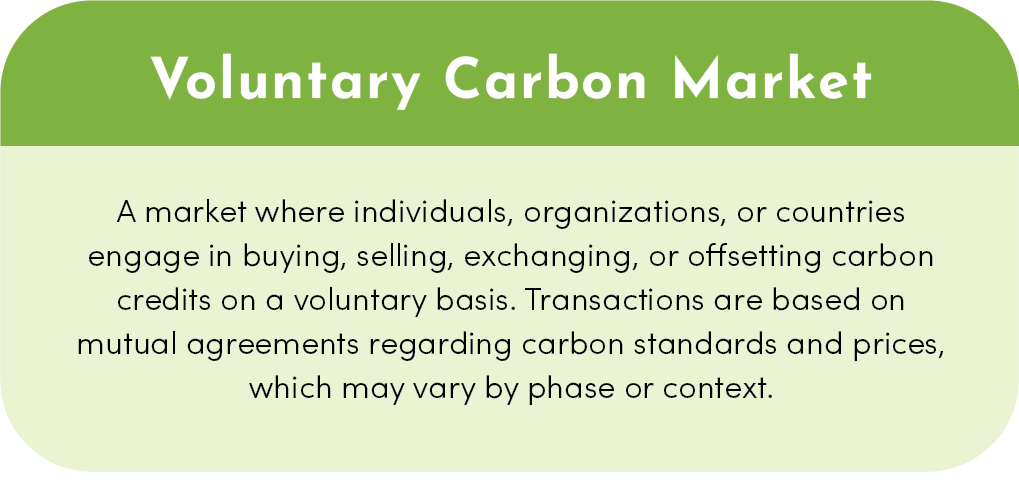

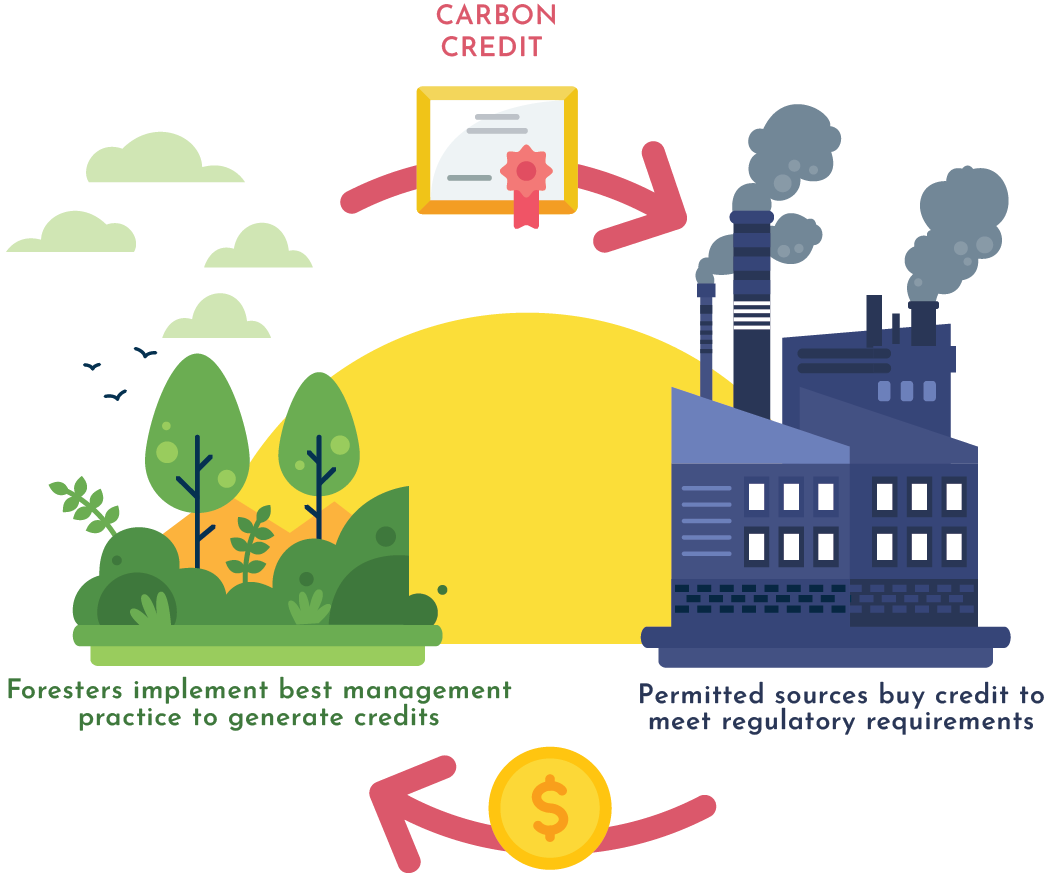
The carbon market is a system in which emission reduction outcomes and carbon credits - including forest carbon credits – are transacted, exchanged, and transferred. There are two types of carbon markets: the Compliance Market (also known as the Mandatory Market) and the Voluntary Market.
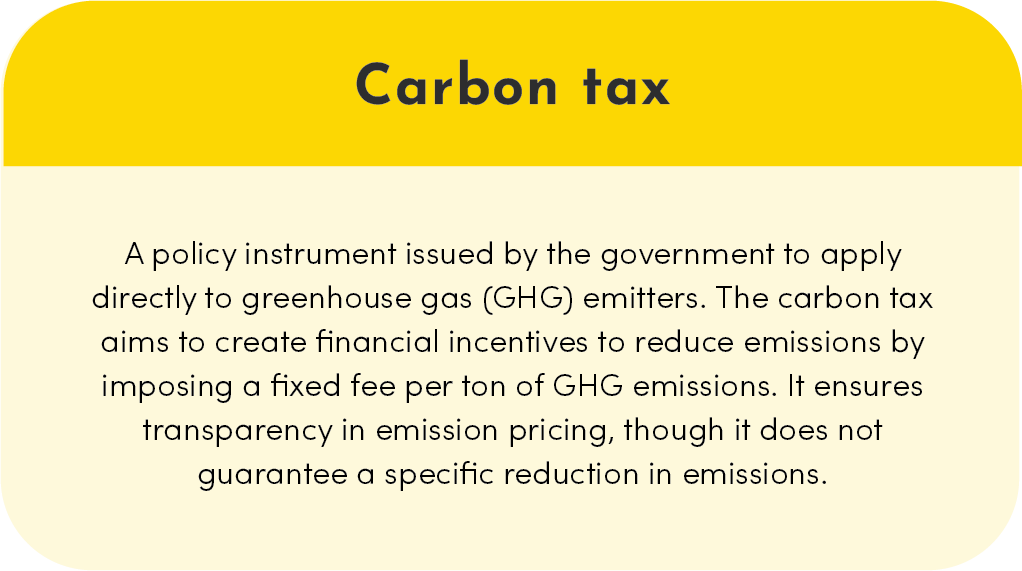
Transactions typically occur through national mechanisms and policies, such as government-imposed carbon taxes, or at the international level, for example commitments to emission reductions under the United Nations Framework Convention on Climate Change (UNFCCC).
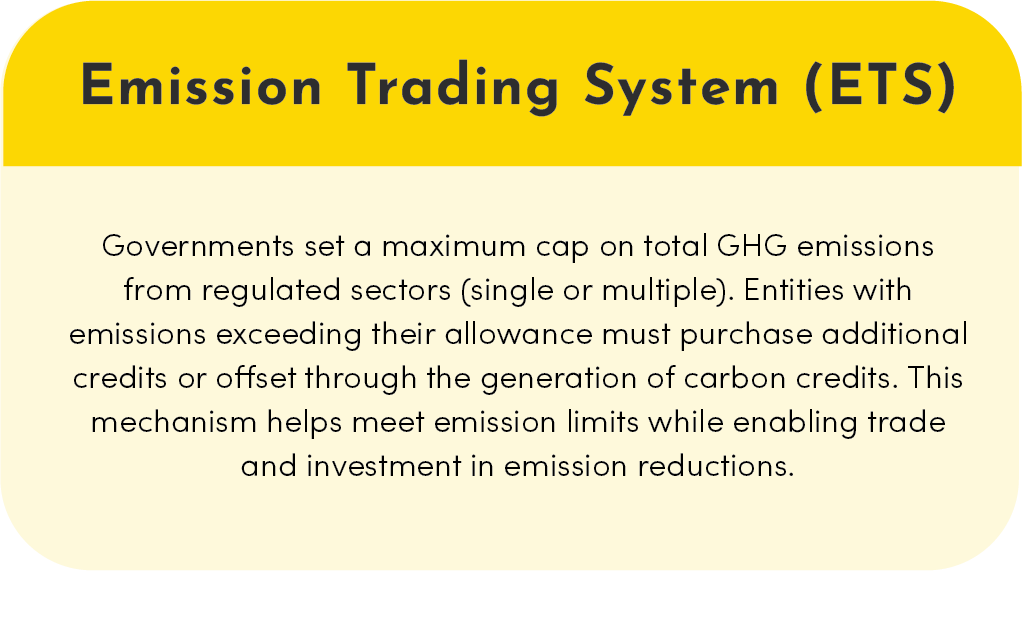
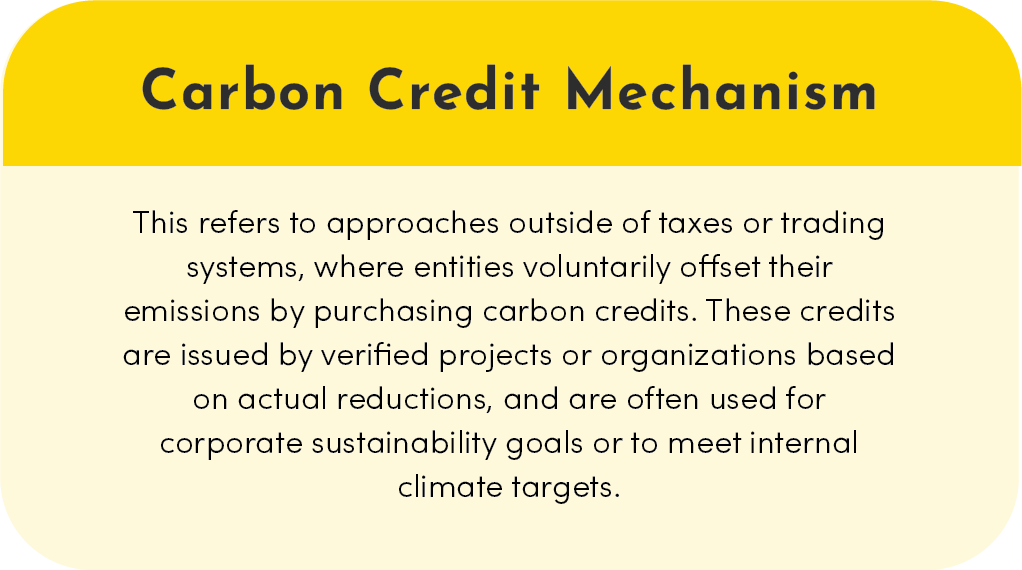
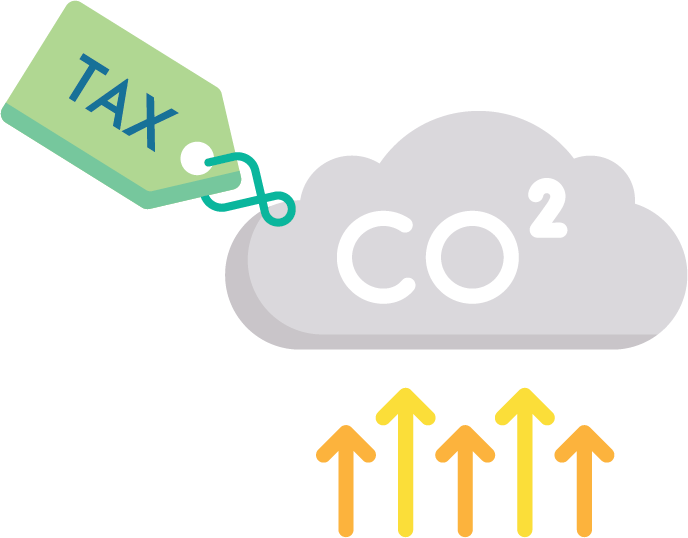
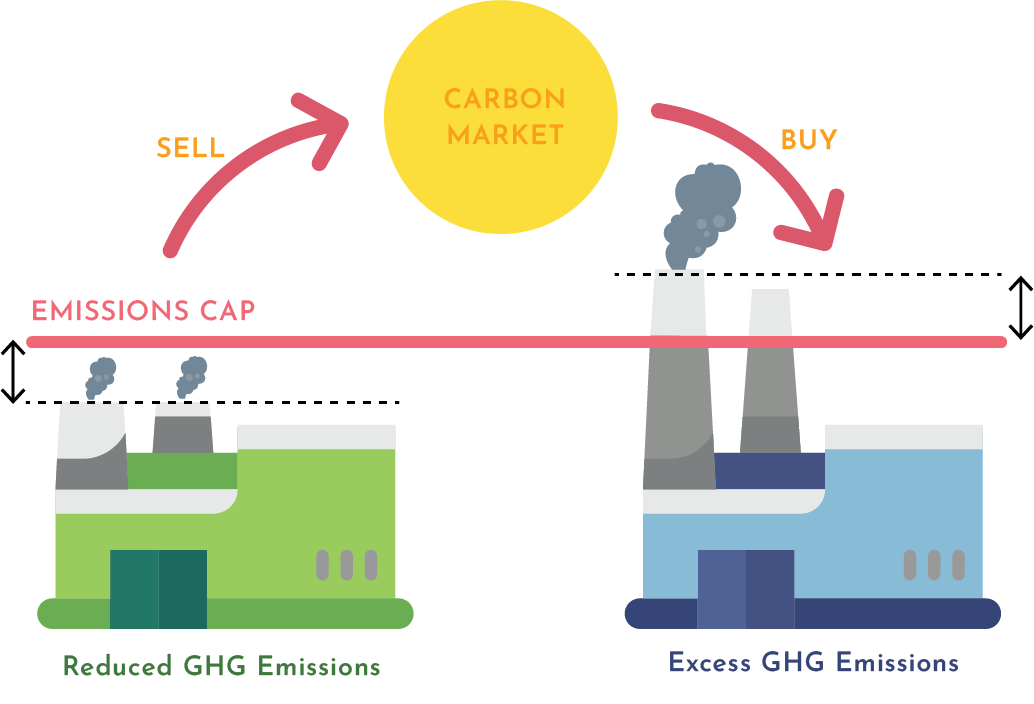
Pricing instruments are mechanisms designed to facilitate the operation of the carbon market. According to the World Bank (2023), there are currently three types of direct carbon pricing instruments in use: (1) carbon tax, (2) emissions trading system (ETS), and (3) carbon credits. Carbon taxes and ETS are applied within the compliance market, while carbon credits are used in both the compliance and voluntary markets. The voluntary market relies solely on carbon credit instruments and does not utilize tax or ETS mechanisms.
* According to the Law on Environmental Protection, a carbon credit is a tradable certificate representing the right to emit one ton of carbon dioxide (CO2) or one ton of carbon dioxide equivalent (CO2e).
The compliance market
According to the World Bank (2025), global revenues from the compliance market - generated through carbon tax and ETS instruments - exceeded USD 100 billion in 2024. To date, around 80 carbon pricing instruments have been implemented worldwide, comprising 43 carbon taxes and 37 ETS. These systems currently regulate around 28% of global emissions. The compliance carbon market is currently thriving in Europe, North America, and Asia. Europe leads with the EU
ETS, while China operates the world’s largest ETS market. Other regions such as North America (California, RGGI), South America (Chile, Mexico, Brazil), India, and Türkiye are also expanding their compliance programs. The World Bank projects that if all mandatory programs under development are fully implemented, the compliance carbon market could grow to cover up to 30% of global emissions.
Figure 1. Areas implementing ETS and carbon taxes (World Bank, 2025)
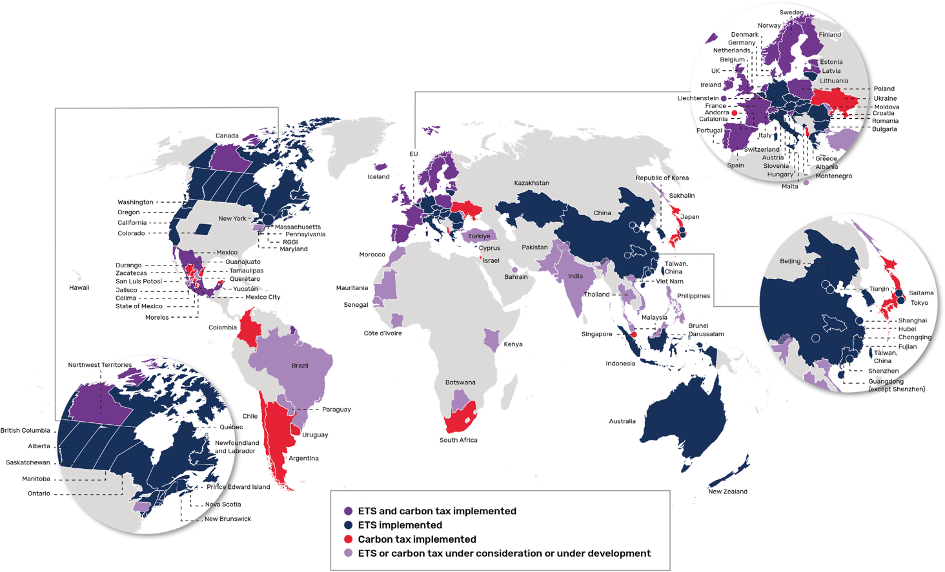
Figure 2. Prices and volumes of greenhouse gases traded in ETS systems across selected countries
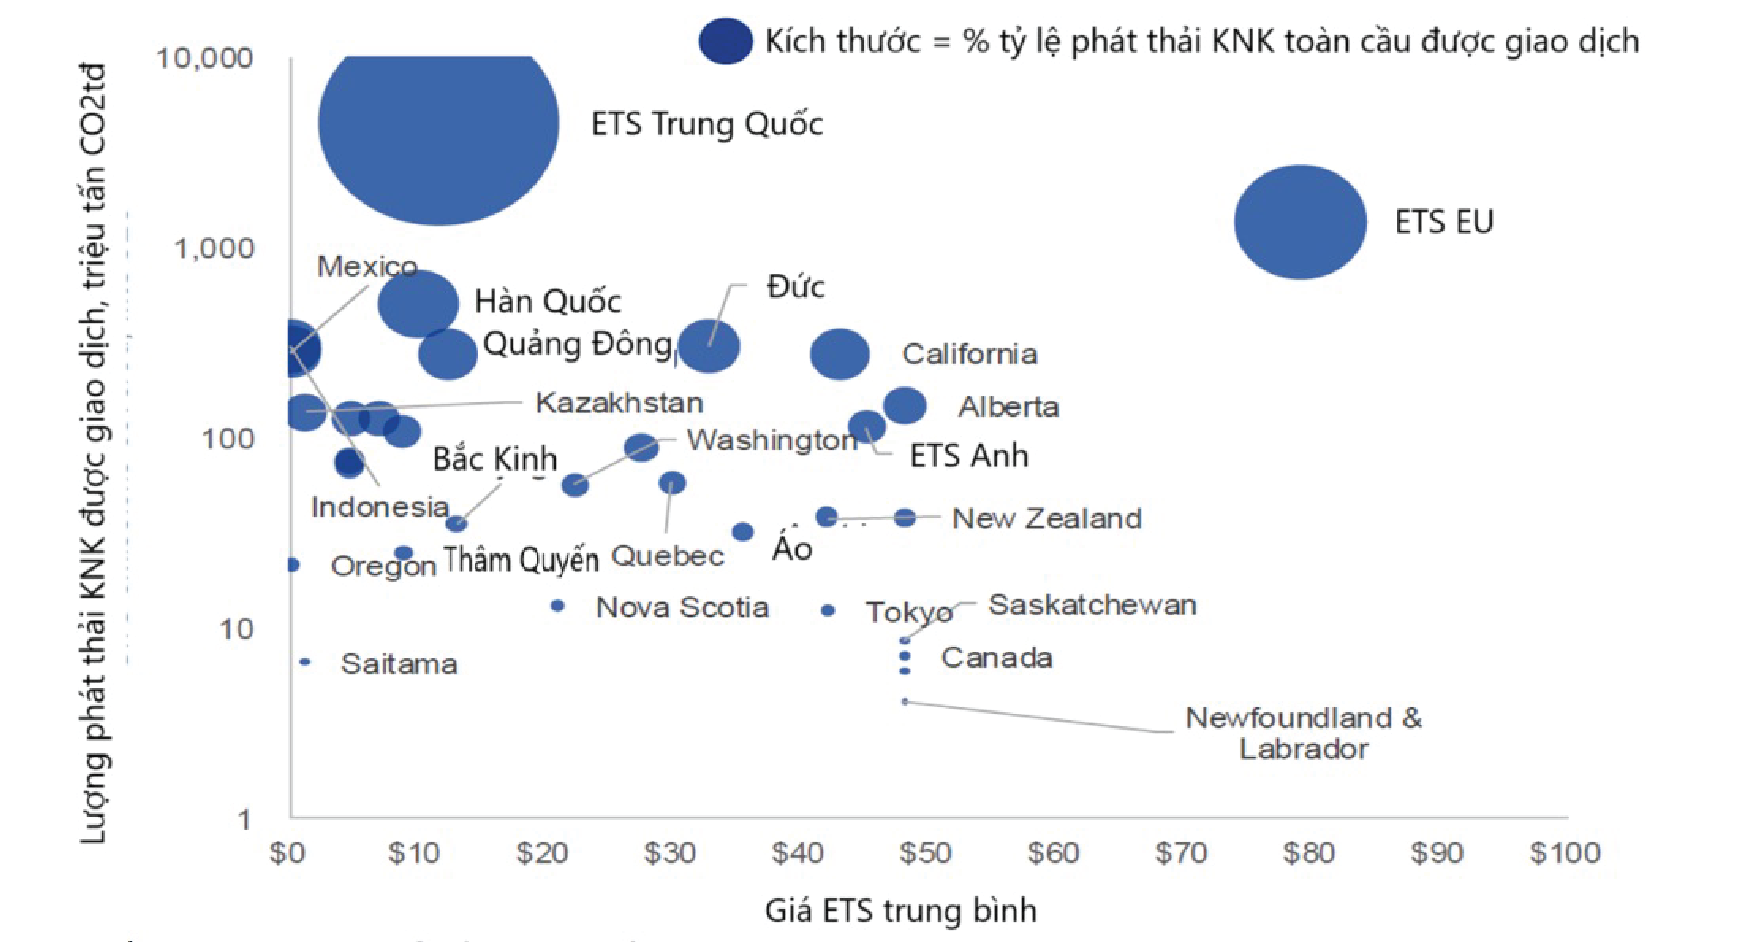
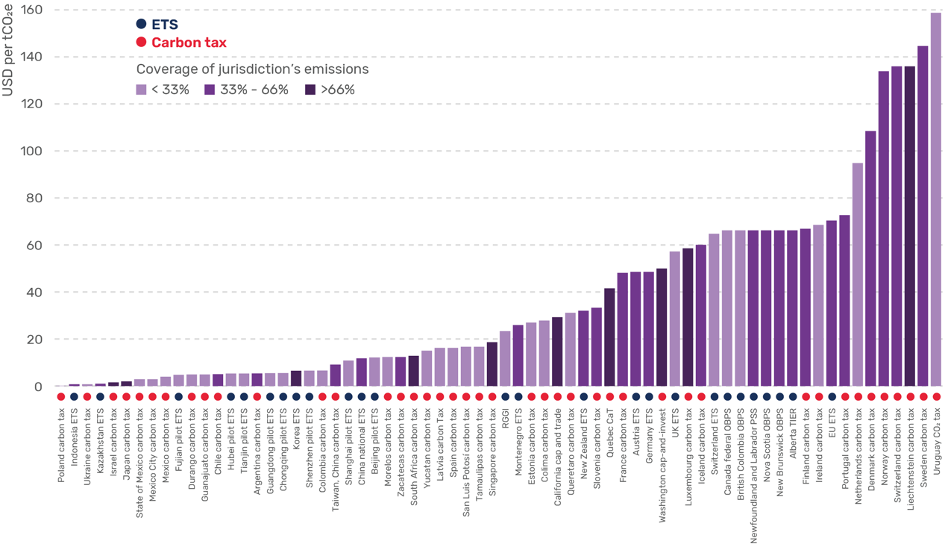
Carbon prices in European markets (EU ETS, Germany, UK ETS) and North American markets (California, Canada) are the highest, typically ranging from USD 50 to USD 70 per ton of CO2e. In contrast, prices in some regional markets in Asia and South America are significantly lower, ranging from under USD 1 to below USD 30 per ton of CO2e.
For emissions trading systems, the lowest carbon price was recorded in Indonesia, at below USD 1 per ton of CO2e, while the highest was in the EU market, at USD 70.4 per ton of CO2e.
Figure 3. Carbon prices in selected compliance markets in 2024
The voluntary market
According to data from the Ecosystem Marketplace (EM) program of Forest Trends, the voluntary carbon market (VCM) reached a value of USD 535 million in 2024 – a 29% decline compared to 2023 - with a total transaction volume of 84 million tons of CO2e. Between 2021 and 2023, the VCM experienced strong growth, with 1,530 carbon projects across 98 countries, trading approximately 254 million tons of CO2e.
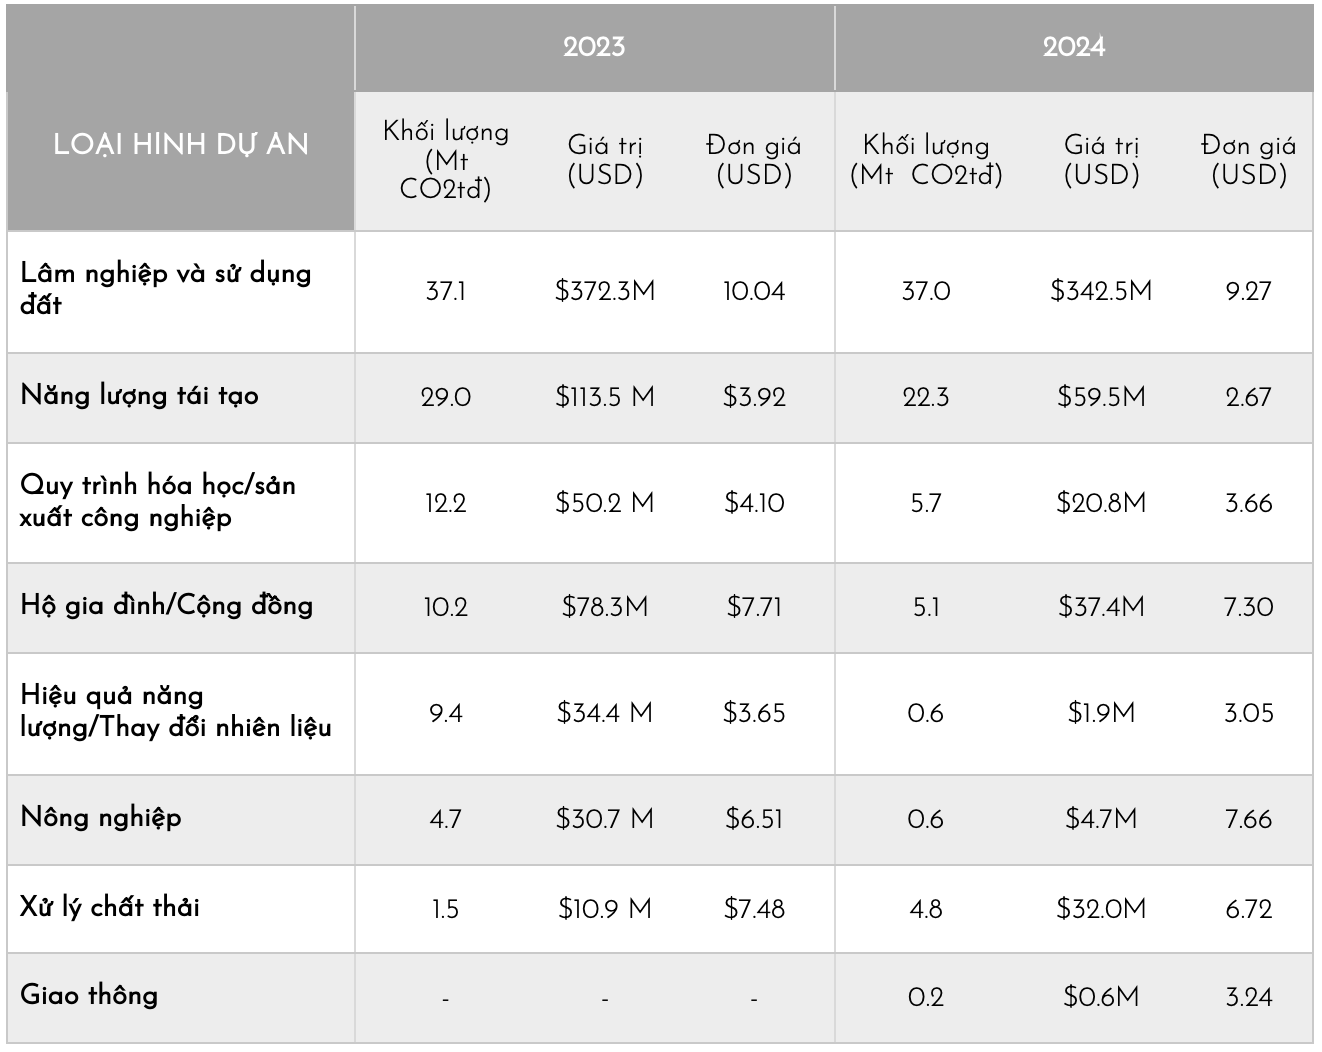
In 2024, the average price of carbon credits in the VCM was USD 6.34 per ton of CO2e. However, prices varied significantly by project type. Carbon credits originating from forestry and land-use projects had the highest average price, at USD 9.7 per ton of CO2e, followed by those from household, community, and waste management projects. Credits associated with co-benefits, such as environmental protection, and biodiversity conservation, also tended to command higher prices.
Figure 4. Size of the voluntary carbon market, measured by the value of traded carbon credits, from pre-2005 to 2024
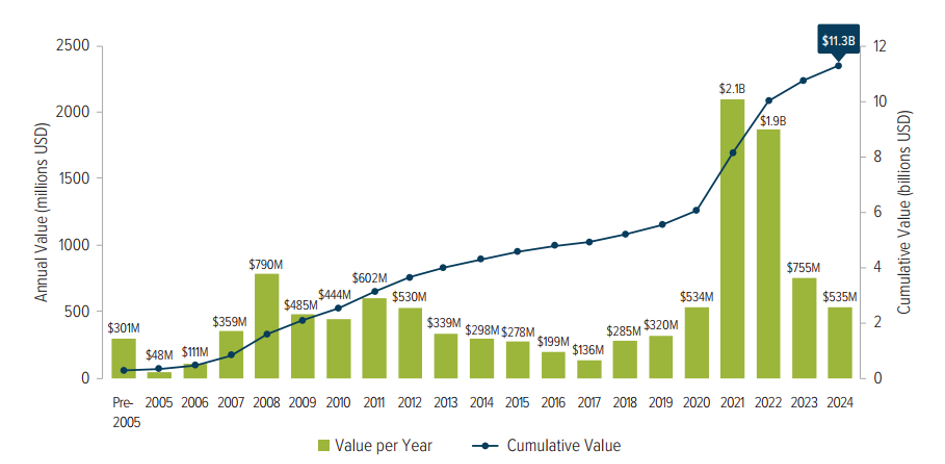
Figure 5. Types of carbon credits by project category
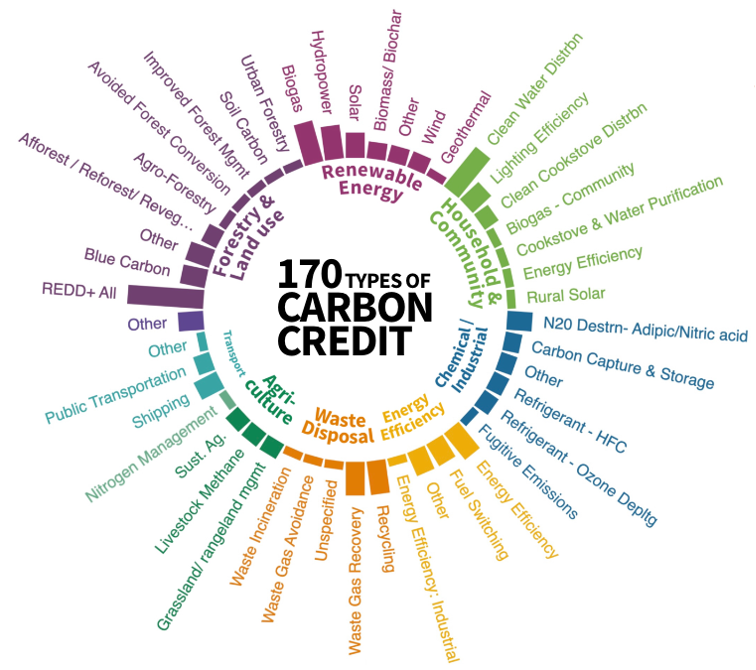
Table 1. Transaction volume, value, and price by project type in the voluntary carbon market, 2022–2024
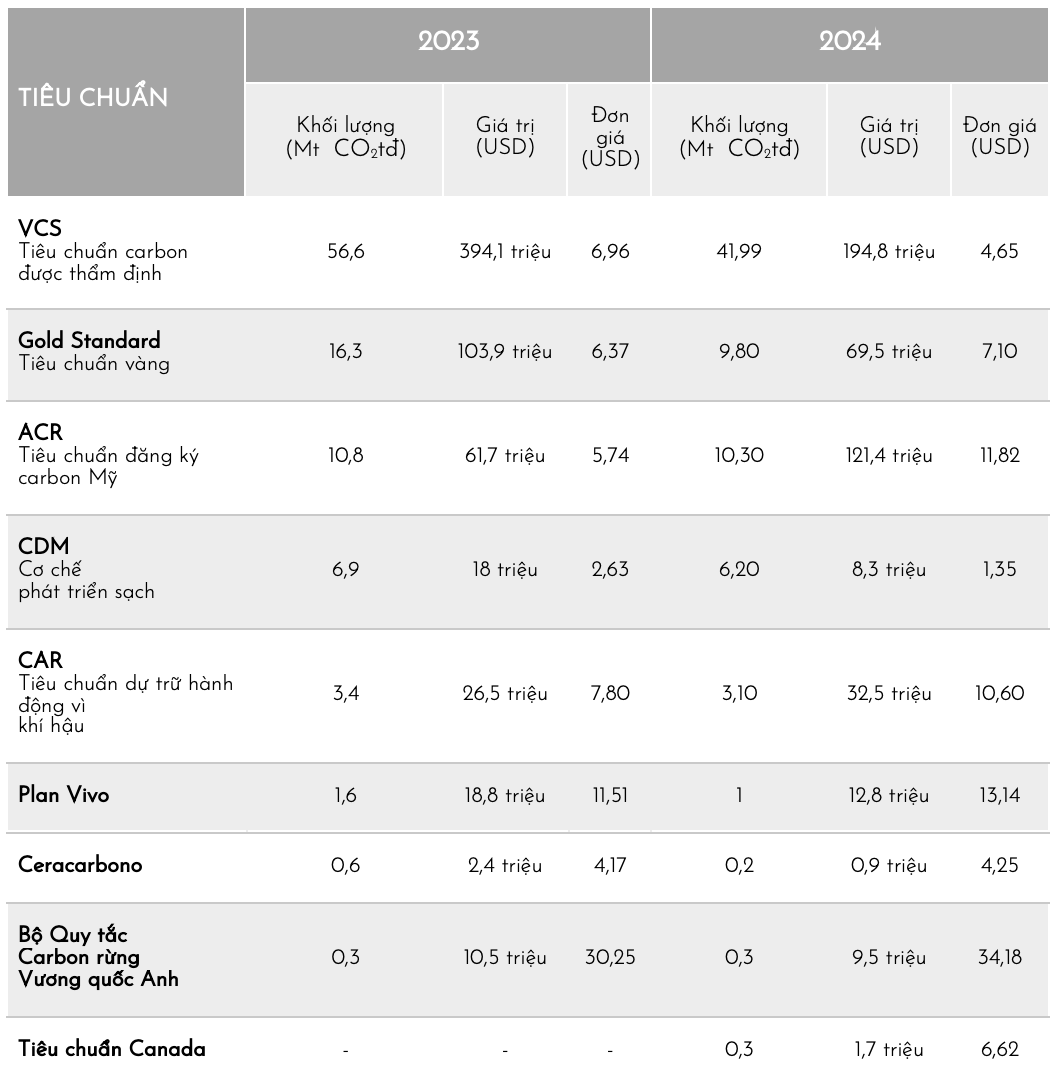
Carbon credits are issued under various standards which determine their pricing. Figure 6 illustrates some of the most common standard types worldwide. Verra dominates project supply, with nearly 10,000 projects spanning more than 100 countries globally (Verra, 2025).
The choice of standard depends on multiple factors, including the type of forest land (e.g., existing forest, newly planted forest, agricultural land), project scale, buyer requirements, and funding mechanisms. Large-scale international projects typically pursue standards like VCS or Gold Standard, while smaller or domestic projects may opt for Plan Vivo, ARB, or specialized standards like WCC in the UK.
In 2024, credits generated from projects applying the UK Woodland Carbon Code commanded the highest average price, at USD 24.31 per ton of CO2e. Conversely, credits applying the CDM mechanism had the lowest average price, at USD 1.13 per ton of CO2e.
Figure 6. Selected carbon standards currently in use
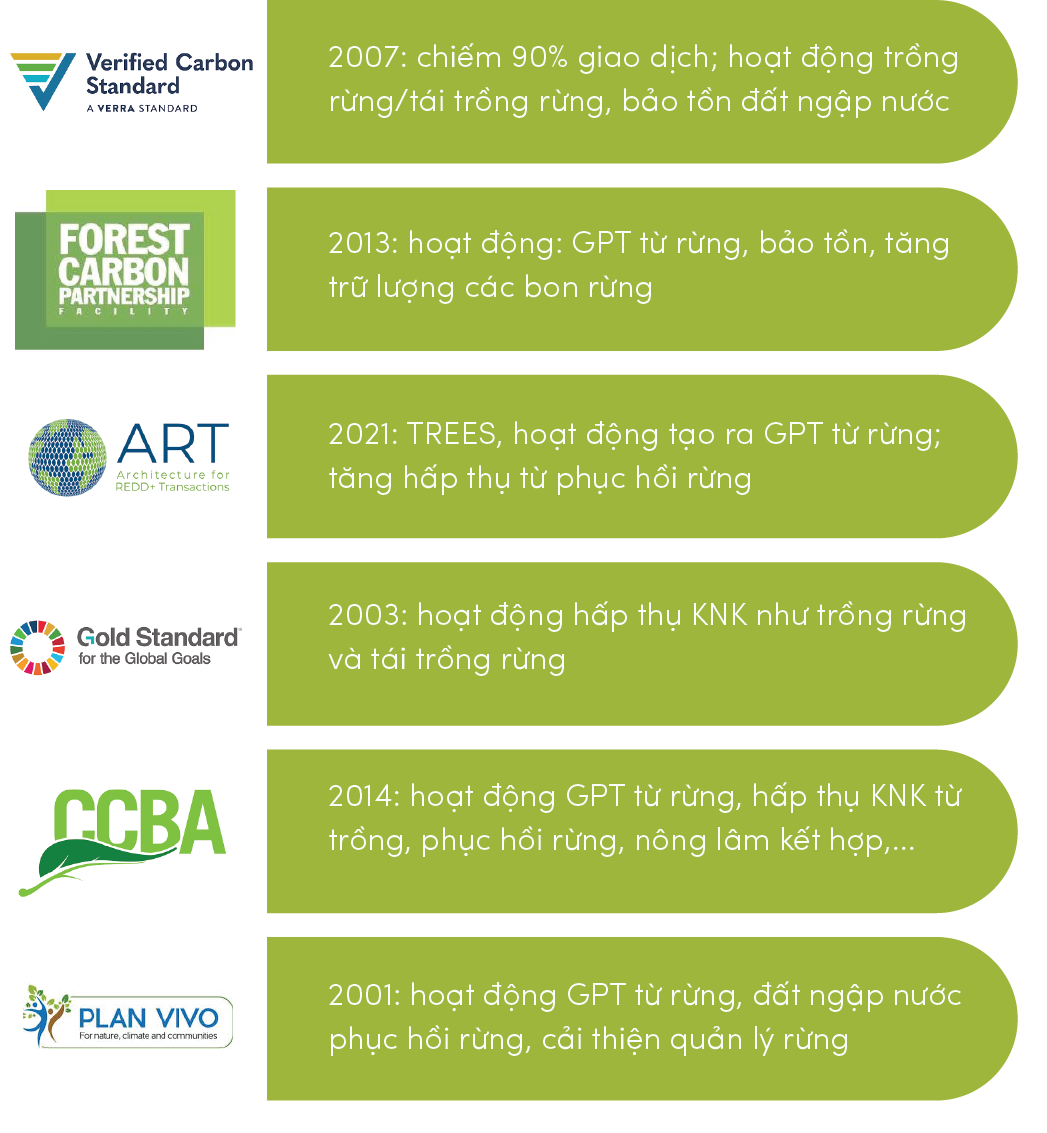
Table 2. Transaction volume, value, and price of carbon standards in the voluntary market
The carbon market is still relatively new in Vietnam. Understanding its major components—such as market types (voluntary, compliance), pricing mechanisms (taxes, ETS, crediting), market scale, and project standards—is essential for stakeholders.
A shared and up-to-date understanding not only keeps actors informed but also lays the foundation for effective engagement and policy development. This, in turn, contributes to building transparent, sustainable carbon markets that can generate future climate finance for Vietnam.